
April 29, 2024 - China revisited.
- Konstantinos Tzavras, CIO
- Apr 29, 2024
- 6 min read
Updated: May 14, 2024

On February 5th, we wrote that the Chinese markets could repeat history and stage a big rally, in a similar fashion to what happened exactly ten years ago. Fast forward to today, and the MSCI China index is up 14% since that day, while the S&P500 is up by just 4%. The Euro Stoxx50 is up about 7% in the same period. The initial rally was triggered by the initiatives of the Chinese government aimed at curbing speculation, increasing participation in the markets and placing a tough new leader at the head of the local regulator, which shows a determination to make the local capital markets investable again. Foreign investors might be revisiting the region soon.
The Hang Seng index rallied by almost 9% for the week, breaking its 50-day and 200-day moving average in those 5 days. What started as a short-term party from local traders, it is now turning to perhaps a more sustainable move higher. Flows from foreign investors are starting to increase, partially reversing the trend of the last two years where they had fled the region in favor of India and Japan. But even the tiniest rotation of large institutional funds from the above countries back into China could lead a to a continuation of the outperformance of MSCI China vs the US and Europe, as valuations are still on the "almost ridiculously attractive" side. Of course, risks are still in abundance, the main one being the upcoming US elections and the targeting of Chinese politics and policies by both candidates in order to win votes.
European and US equities also rebounded, with the help of some corporate results towards the end of the week. The EuroStoxx 50 rose by 2%, and the S&P500 outperformed with a a 2.7% gain, but it was Nasdaq who led with a 4% gain. Swiss stocks had a rough week, as index-heavyweights Nestlé and Roche lost ground after their Q1 results. The Swiss SMI rose by just 0.6%. On the contrary, UK's FTSE100 rose to a record high, as Materials, Energy and Financials attracted investors' interest on the back of Technology and Growth weakness at the start of the week.
The Eurozone Composite PMI improved much better than expected. It increased 1.1 points to a 11- month high of 51.4, the second month in a row above the 50 level. The increase was driven by a further pick-up in the Services PMI (+1.4 points to 52.9), while the Manufacturing PMI slipped 0.5 points to 45.6. The divergence between services and manufacturing was notable in the new orders component, which rose markedly in services but fell in manufacturing. Composite input and output price indices rose a bit, with companies reporting higher wage growth and increased energy and fuel costs.
The US April PMIs revealed surprise weakness, as manufacturing PMI fell a whopping 1.9 points to 49.9. Among the components, new orders fell 3.1 points to 49.5, moving back into contraction after spending the first three months of 2024 in expansion. The employment index fell 0.3 points in April to 51.9. The Services PMI fell almost a point to 50.9, while the new business conditions index dropped by 3.4 points to 48.1. From 2009 to the pandemic, the new business index had only once barely dipped below 50, in October 2019 to 49.9, making this reading particularly weak. The employment index declined 3.8 points to 47.3, its first contractionary reading and worst level since June 2020.
The Q1 US GDP growth rate was weaker than expected. It was announced at 1.6% quarter-on-quarter (annualized) vs expectations for 2.2%, with the weakness stemming primarily from durable goods and defense. Overall, Personal Consumption slowed down to 1.7% vs 2.2% in the previous quarter and net exports contracted 0.9% vs +0.25% previously. Government spending also decelerated markedly to 0.2%, the lowest increase since 2022. On the contrary, spending on Services was far stronger at +4%, vs +3.4% of the previous quarter. The data are consistent with a resilient consumer, as per the latest retail sales data and the credit card balances which "are through the roof", even if overall spending seems to be decelerating, but not fast enough. These data confirm that inflation will remain higher than the 2% FED's target, until consumer demand for goods and services takes a bigger hit.
The FED's favorite inflation metric rose slightly more than expected in April. On a monthly basis the PCE Deflator rose by 0.32% vs expectations for 0.30%. which caused the annual change to rise by 2.8% vs expectations for 2.7% higher than 2.5% of March. The Core PCE Deflator was also announced at 2.8%, flat vs March. Overall the data were taken as "not bad" given the recent fears of the market and the bond market staged a mini relief-rally on Friday.
The FED meeting this week will definitely attract attention. The market expects a more "official" confirmation that the rate cut in June has a low probability, although they can always surprise us. The bond market has sold off recently, in anticipation of the FED meetings on 1st May and then June 12th, which were supposed to pave the way for rate cuts, but this is probably not happening. The US 10-year yield reached a high of 4.72% during the week, but fell back to 4.65%, while the German equivalent rose to 2.65% before settling below 2.60%. On the positive side, the week's US Treasury auctions were rather successful alleviating fears of a further sell-off in US government bonds.
Eurozone April inflation data are due this week. Ahead of these numbers, the German Federal Statistics Office Destatis published the March data which showed that the base wage growth accelerated to 4.4% y/y (a new historical high), up from 1.9% in February. As a reminder, the ECB has made it clear that the June rate-cut decision will be made after careful consideration of how inflation has fared until then and most importantly how wages and company profit margins have behaved. The latest wage data are causing some concern.
Chart of the Week : "Higher for longer" could entail risks.
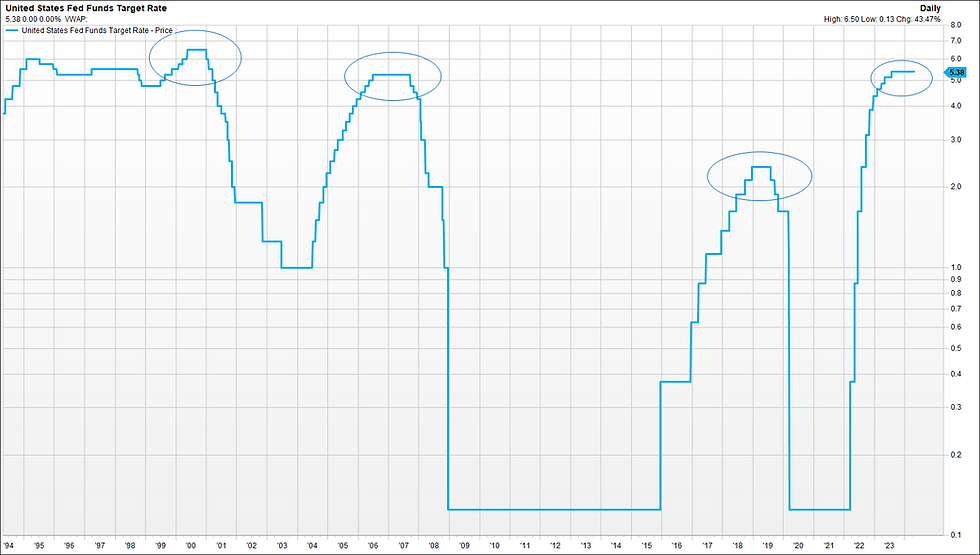
The above charts shows the evolution of the FED's rates in the last thirty years. The first thing to notice of course is how steep the 2022-2023 rate hikes campaign has been, which compares to nothing we have seen in this long period. The second observation is that judging from this 30-year history, when the FED has risen rates continuously and then it stops before the first rate cut, this pause is usually 5-7 months. In 2000, the FED cut rates just 5 months after it stopped raising them and in 2019 it took them 7 months. It was only in 2007, when they waited for about 14 months, before they cut. Fast forward to today, if the FED cuts rates in June it would be 9 months after the last rate increase and given that the recent rhetoric is against this happening, then we are probably in a similar situation like in 2007: higher for longer. Of course, knowing what happened afterwards back in 2007-2008 and the collapse of the US financial system, we would rather wish to have rate cuts sooner than later.
Disclaimer
• The content of this document has been produced from publicly available information as well as from internal research and rigorous efforts have been made to verify the accuracy and reasonableness of the hypotheses used. Although unlikely, omissions or errors might however happen.
• The data included in this document are based on past performances and do not constitute an indicator or a guarantee of future performances. Performances are not constant over time and can be positive or negative.
• This document is intended for informational purposes only and should not be construed as an offer or solicitation for the purchase or sale of any financial instrument and it should not be considered as investment advice. The market valuations, views, and calculations contained herein are estimates only and are subject to change without notice. Any investment decision needs to be discussed with your advisor and cannot be based only on this document.
• This document is strictly confidential and should not be distributed further without the explicit consent of Kendra Securities House SA.
• Sources: Chart of the Week : FactSet, Photo:: Vox China


Comments