
Markets are entering a tricky part of the year, at full speed.
- Konstantinos Tzavras, CIO
- Jul 7, 2025
- 6 min read
Updated: Oct 6, 2025
July 7th, 2025

Financial markets are currently at an important crossroads. The US main indices have just registered a record high, only three months after their were down 20% for the year. The algorithmic programs (CTAs) have played a major part in this, as they have re-leveraged and chased the market higher as the indices broke some technical levels. US equity valuations are now pricing absolute perfection and significant growth for companies' revenue and earnings, although these have been downgraded meaningfully since the start of the year. Europe has returned close to its previous highs, but momentum for the region's hot stocks seems to have eased. Corporate bond spreads, whether high yield or investment grade, are back at very low levels and government yields are on the rise, offering little hope for further capital gains for this asset class in the next few months. And we have entered the tricky summer months when volumes are much lighter and investor attention is primarily focused on having a long drink on a beach. At the same time, the world does not look any better than three months ago.
The 9th July tariffs deadline, set by President Trump, is just in two days. The good scenario is a further extension, based on an "agreement on principles" of a trade deal between Europe and the US, as Mrs. Von der Leyen said that they are working on. She also mentioned the obvious, that a complex trade deal could not have been completed so soon. US Treasury Secretary, Mr. Bessent, neither dismissed nor sided with this notion of a "deal on how to make later a deal". The bad scenario is if President Trump returns to his "liberation day" announcements, offers no extension and chaos erupts again in financial markets. The fact that last week he said to a journalist "I feel more powerful than ever" shows that the bad scenario might carry a higher probability than what the markets are pricing. But, we should also keep in mind the taco (i.e. Trump Always Chickens Out), which offers hope that the sell-off in US financial assets is very fresh in his memory.
The "Big Beautiful Bill" has now been passed by Congress, after fierce debates among fellow republicans. The bill will essentially maintain the status quo of taxation for corporations and personal income, which means that it is not really a reason for markets to rally further from an already new record high. Now the question that arises is whether to maintain the status quo is really beneficial to the US economy. On a short-term basis, it removes a potential drag on the economy, as higher taxes would have stalled the already falling growth. But the status quo is also a 7% fiscal deficit for a government which has already borrowed more than 100% of its GDP and is approaching the highest level of debt since the 2nd world war. Not to mention that servicing this debt alone (i.e. paying the interest) now costs more than 3% of GDP every year.
The US labor market data were rather weak, despite the seemingly better than expected non-farm payrolls. Those were announced at +147k for June compared to the consensus of +117k. In a similar pattern as in May, private sector employment moved down, while government jobs surged, contributing almost half of the estimated job creation (+75k). It is worth noting that in June of last year, government jobs were again initially estimated to have increased by 70k, only to be revised down by more than 50k in the months that followed. The unemployment rate fell to 4.1% from 4.2% but this was more of a technicality, as 200k previously classified as unemployed people left the workforce and hence were removed from the calculation of unemployment. In other data, continuing jobless claims stayed at 1.964mn, the highest since the pandemic.
Eurozone June headline inflation ticked up 0.1pp to 2%, in line with consensus expectations. This small increase was solely driven by higher energy inflation, more than offsetting a drop in food inflation. Core inflation remained unchanged at 2.3%. Within core, services inflation was up 0.1pp to 3.3%, while goods inflation eased by 0.1pp to 0.5%. Looking ahead, headline inflation is expected to stay around 2% for the rest of 2025, as the big appreciation in the EURUSD rate also acts as a natural dampener of imported consumer goods' prices. With inflation in check and given the fact that economic growth is expected to accelerate due to the planned infrastructure spending in Europe, the ECB's rate -cutting cycle seems to be nearing its end.
Equities had a rather mixed week. Investors continued to buy US stocks , bringing the main local indices to fresh record highs, with the S&P500 adding 2% for the week and is now up 7% for the year. Europe was mildly down (-0.5%) with Germany underperforming (-1%), but still up by almost 20% for the year. It is worth mentioning the sizable rotation into consumer names and out of the usual suspects/winners in Europe last week. Beaten-down stocks in the luxury, autos and beverages sectors rallied more than 10% from their recent lows in a matter of days, showing that if and when a rebound happens, this will be fierce as the investment community is heavily underinvested in these.
Bonds had a tough week. First the UK market had a "Liz Truss" moment after PM Starmer appeared to part ways with his Treasurer, Mrs. Reeves, on grounds of disagreeing on the need to reduce the deficit, with yields shooting up 20bp in a matter of minutes. Later, the situation was resolved, with the Mrs. Reeves claiming it was a personal issue that made her shed tears, live on TV, during the parliament's session. Germany's fiscal expansion is always on the bond investors' mind when trying to find an excuse to sell. Finally, the passage of Trump's bill is not very friendly to the US bond market, as it poses a high risk of ballooning further the already high deficit. The 10yr US yield rose to 4.35%, still low vs a few months ago, while the German 10yr yield rose above 2.60%, before falling back again at the end of the week. We would avoid new positions in long-term bonds at this stage, despite the rise in government yields.
The second quarter corporate earnings are about to start, in the US. The estimated (year-over-year) earnings growth rate for the S&P 500 is 5.0%, and interestingly at the end of March, the estimated growth rate for this same period was almost double, at 9.4%. Having lowered expected earnings so much leaves the door open for positive surprises, of course, but it also means that the current fresh record of the S&P500 needs a lot of these, in order to make any sense.
Chart of the Week : Platinum has finally woken up.
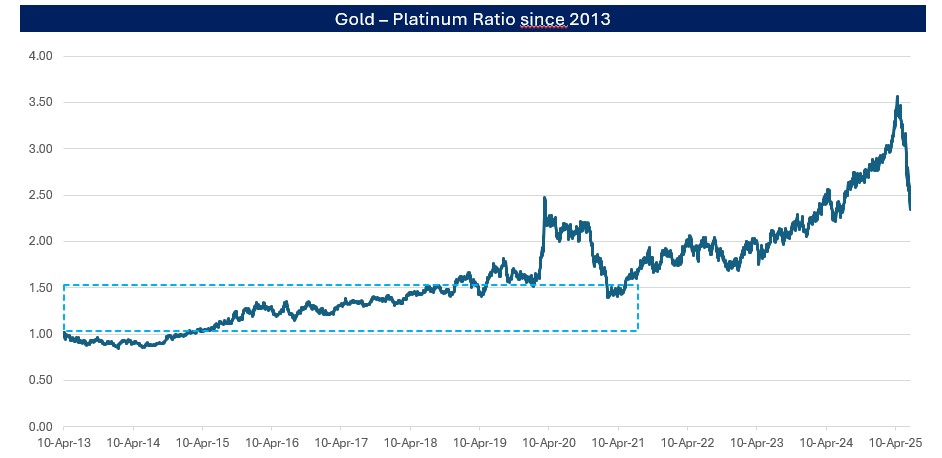
The above chart shows the ratio of Gold to Platinum prices since 2013. As can be seen, for almost a decade Gold's price was about 20-50% higher than Platinum's and those readers of a certain age would remember that Platinum was "always" worth more than gold, as their American Express cards would also remind them. Things changed dramatically after the pandemic, and especially after the inflation surge in 2022. Gold prices soared , while Platinum stayed unchanged or even fell, as investors categorize the latter more of an industrial metal than precious. The Gold-Platinum ratio reached an unsustainable high of 3.5 a few months ago, which sparked a large rotation between the two metals. Platinum's rally has made this ratio to collapse to around 2.5 currently, which means that if we were to return to levels seen just 2-3 years ago, then its outperformance could be significant over Gold.
Disclaimer
• The content of this document has been produced from publicly available information as well as from internal research and rigorous efforts have been made to verify the accuracy and reasonableness of the hypotheses used. Although unlikely, omissions or errors might however happen.
• The data included in this document are based on past performances and do not constitute an indicator or a guarantee of future performances. Performances are not constant over time and can be positive or negative.
• This document is intended for informational purposes only and should not be construed as an offer or solicitation for the purchase or sale of any financial instrument and it should not be considered as investment advice. The market valuations, views, and calculations contained herein are estimates only and are subject to change without notice. Any investment decision needs to be discussed with your advisor and cannot be based only on this document.
• This document is strictly confidential and should not be distributed further without the explicit consent of Kendra Securities House SA.
• Sources: Chart of the Week : KSH/FactSet Cover photo:


Comments